Jesse D. Jenkins
Average day-ahead electricity market prices across the PJM market fell 55 percent from 2008 to 2016. Declining prices in PJM and other wholesale electricity markets across the United States have contributed to the retirement of several nuclear power stations. Roughly half (BNEF 2016) to two-thirds (Haratyk 2017, CEEPR WP 2017-009) of the U.S. nuclear fleet may be operating at a loss in current market conditions. Nuclear power plants generate 20 percent of U.S. electricity and constitute the nation’s largest source of emissions-free power. As such, determining the causes of deteriorating economic conditions at these nuclear plants has important implications for both the future of U.S. electricity markets as well as state and national efforts to reduce emissions of carbon dioxide and conventional pollutants.
This paper (CEEPR WP 2018-001) provides the first empirical estimates of the causal effect of three primary factors that might explain the decline in wholesale day-ahead electricity market prices received by nuclear plants in PJM: (1) stagnant or declining electricity demand; (2) growth in wind energy generation; and (3) declines in natural gas prices. The study estimates the impact of each factor on electricity prices at the location of 19 different nuclear plants across the PJM market. These plants are home to 33 individual reactors and encompass roughly one-third of the U.S. nuclear fleet, including 11 reactors currently facing possible retirement.
To estimate the effect of changes in daily natural gas prices and daily average electricity demand and wind generation in PJM and the adjoining MISO market region, I employ a time series ordinary least squares regression with time fixed effects using 3,288 daily observations for the nine-year period from January 1, 2008 to December 31, 2016. I then use the resulting coefficients to estimate the cumulative effect of changes in the three explanatory factors from 2008 to 2016 on annual average market prices for each nuclear generator. In addition, the locations of the nuclear plants span from the mid-Atlantic states in the east to Illinois in the west. I take advantage of this fact to explore geographic variation in the effects of each explanatory variable.
I find that a roughly 3.5 percent decline in electricity demand across the PJM and MISO electricity markets from 2008 to 2016 is responsible for a statistically significant but modest decline in electricity prices at all 19 nuclear plants in PJM. The cumulative effect of changes in demand over this period is on the order of a 1.5 to 4.0 percent decline in the average prices earned by these plants. Declining demand has a greater impact on electricity prices at plants in the east (closer to major population centers) than those in the western portion of PJM. In other words, it is fair to say that electricity prices earned by nuclear plants in PJM would have been a few percentage points higher had demand in PJM and MISO remained steady at 2008 levels. Prices would have been higher still had demand continued to grow at over 1 percent per year, as projected by many analysts prior to the Great Recession.
Annual average wind energy generation in MISO and PJM grew more than five-fold since 2008 to supply 4.4 percent of electricity demand in the two market regions in 2016. This growth had a modest and statistically significant effect on electricity market prices only at nuclear plants in the western portion of PJM (e.g., in Illinois, Michigan, and Ohio). For these plants, the cumulative impact of growing wind generation was of a similar magnitude as the effect of declining electricity demand—a roughly 1 to 6 percent decline in average prices. For all other nuclear plants in PJM, growth in wind generation does not appear to have had a statistically significant effect on electricity prices.
Finally, due to surging domestic production of gas unlocked by hydraulic fracturing and horizontal drilling techniques, market prices for natural gas declined 72 percent from 2008 to 2016. Across a variety of specifications presented in this paper, the drop in the price of natural gas appears responsible for the majority of observed declines in electricity prices across the 19 PJM nuclear plants over this period—e.g., 50 to 86 percent of observed changes in the primary specification.
The methods employed here produce a less precise estimate of the effect of natural gas than for the other variables. Point estimates for the cumulative effect of changes in gas prices from 2008 to 2016 range from a roughly 20 to 85 percent decline in electricity prices depending on the location of the plant and which model specification is used. Furthermore, 95 percent confidence intervals span plus or minus 8 to 29 percentage points around these point estimates across plants and specifications.
Despite this variance in estimated effects, one can confidently conclude that the impact of declining gas prices on nuclear plant revenues in PJM is an order of magnitude greater than the impact of either declining electricity demand or the growth in wind energy generation over this time period. Changes in gas prices also appear to have had a greater impact on prices earned by nuclear plants in the eastern portion of PJM, although effects are large and statistically significant for all plants in the PJM footprint.
In short, cheap natural gas appears to be killing the profitability of nuclear power producers in the PJM Interconnection. That said, stagnant electricity demand and expectations of future growth in wind generation going forward may be accomplices.
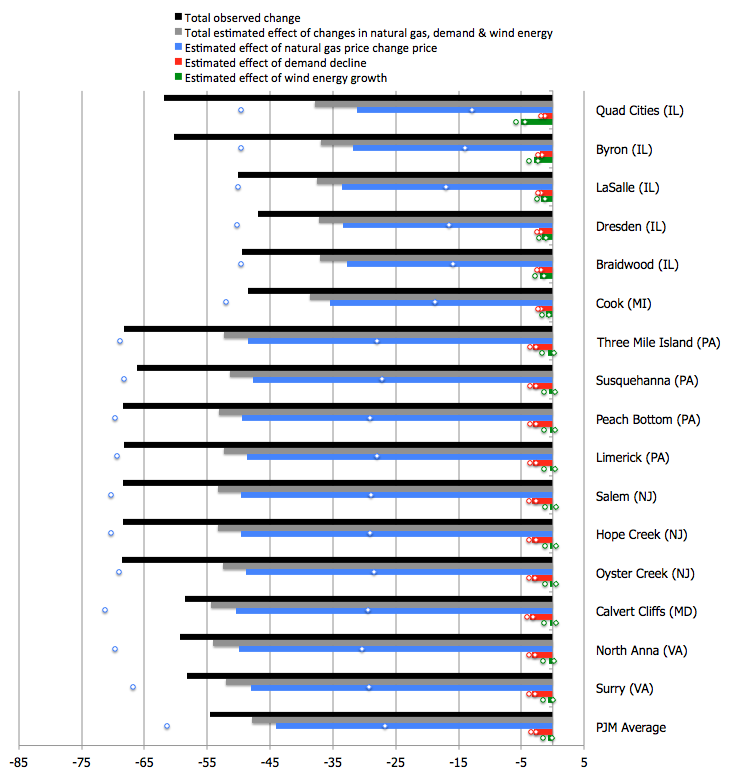
Figure 1. Estimated effect of cumulative observed changes in average demand, wind generation, and natural gas prices from 2008 to 2016 on annual average day-ahead electricity market prices for 16 nuclear generators in PJM (Estimates for Davis Besse, Perry, and Beaver Valley plants are excluded as the data series for these plants begins in 2011). Circles depict 95 percent confidence intervals for each estimate (using Newey-West HAC standard errors). Estimates are based on counterfactual 2016 predictions adjusting actual 2016 daily observations to reflect the percent change between annual average 2008 values and annual average 2016 values for each time series. Total observed change in annual average prices from 2008 to 2016 presented for comparison.
References
BNEF (2016). Reactors in the red: financial health of the US nuclear fleet, Bloomberg New Energy Finance, July 2016. http://docplayer.net/ 26060517-Reactors-in-the-red-financial-health-of-the-us-nuclear-fleet.html.
Haratyk, Goeffrey (2017). Early nuclear retirements in deregulated U.S. markets: Causes, implications and policy options, Energy Policy, 110: 150-166.
Further Reading: CEEPR WP 2018-001
About The Authors