Below a message from our Institute Innovation Fellow, Brian Deese:
Dear Colleague,
Three months ago, we launched the Clean Investment Monitor, along with our partners at Rhodium Group. Our goal is to provide a publicly-available, comprehensive, methodologically consistent, and timely way of assessing actual investment in GHG-reducing technologies across the U.S. economy. Our inaugural report revealed a 165% increase in actual investment in cleantech manufacturing, deployment, and retail compared to five years ago.
We have released our first quarterly update, which I wanted to share with you. And, I want to encourage anyone with interest and appetite to use this data in their own work. A core goal of ours is for this data to inform the essential research and policy work that you all are executing — so please reach out for the bulk data at [email protected].
Now, a few toplines from the Q3 report, for those interested:
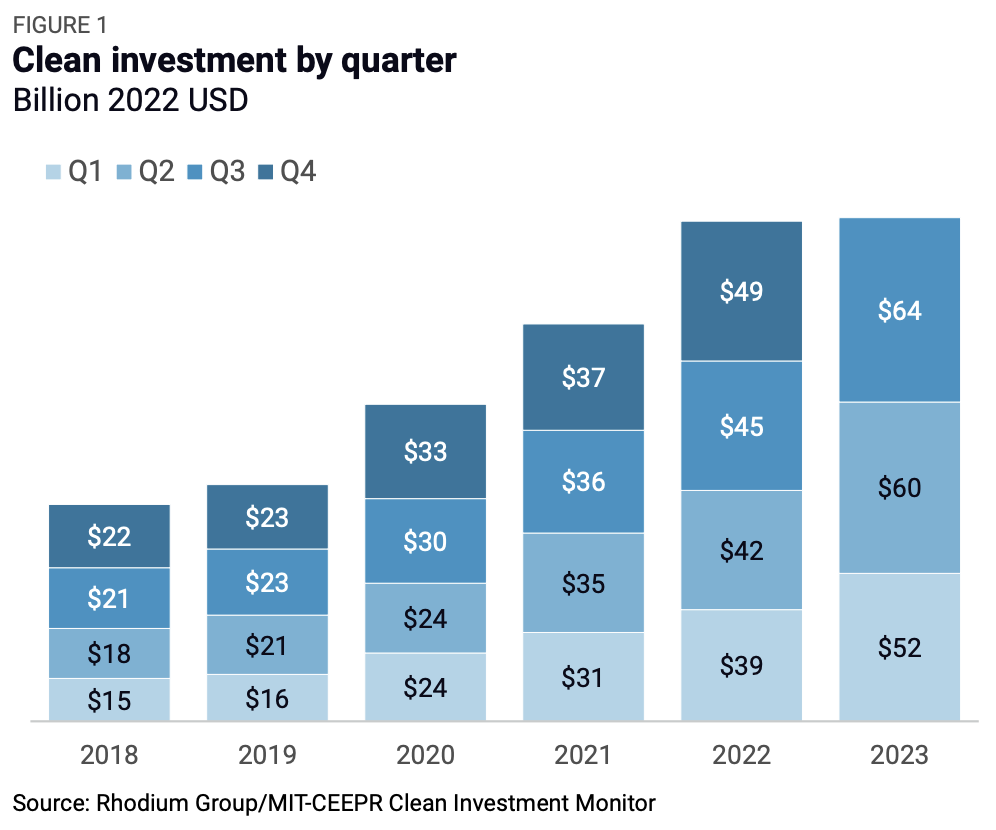
The data show $64 billion in clean investment in the US in the third quarter of 2023 – the largest amount invested in clean energy in any quarter – bringing total clean investment to $225 billion over the last year. Cleantech comprises a quickly growing share of the US economy: 4.9% of total domestic private investment, up from 3.4% this time last year and 1.8% in 2018.
I’ll leave it to you to explore the report’s findings, which include a breakdown of investment patterns across segments and technologies, as well as states. But, highlighting a few facts that I believe are of particular interest:
We are beginning to see innovation translate into deployment w/ a surge in actual investment in emerging climate technologies. Clean H2, SAF, and carbon management are experiencing actual investment 10x what we saw last year.
Manufacturing remains a key driver of investment growth, propelled by the EV supply chain. This segment saw the most growth in Q3 2023, with $14 billion of new investment in the manufacture of clean energy and transportation equipment, up 11% quarter-on-quarter and 171% year-on-year.
By state, Nevada ranks first with clean investment as 2.1% of gross state product, while our fair Massachusetts ranks 45th with clean investment as 0.4% of gross state product.
I would also note three ways that this data provide nuance to some of the recent press narratives around clean energy investment in a challenging macro and interest rate environment:
Consumer demand for ZEVs remains historically high. Q3 retail spending increased 6% quarter-on-quarter to $21 billion – up 37% year-on-year, slightly faster than Q2.
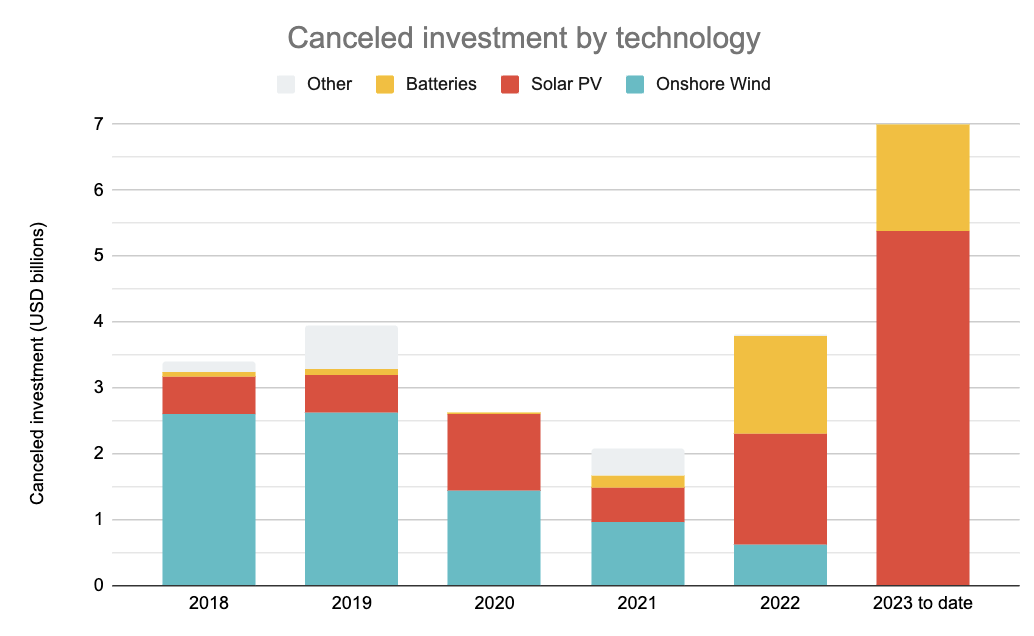
Actual investment in wind deployment is picking up, with a 20% increase in Q3 that begins to reverse two years of steep decline. This is being driven by onshore wind. We will see if cancellations, particularly in offshore, in Q4 bring further turbulence.
Despite media attention on wind investment, the vast majority of recent project cancellations are in the solar PV and batteries sectors. While there has been a pick up in canceled investments, the overall quantity remains relatively low as a share of total actual investment (0.20% in 2023 YTD, compared to 0.11% in 2019).
I’m grateful to many of you for your collaboration in building this resource. Again, its intent is to be valuable to this community’s research and public policy objectives – so we encourage anyone with interest and appetite to engage with the data and share feedback on how we can further improve its utility.
Best,
Brian
Further Reading: CIM Q3 2023 Update
Link: Clean Investment Monitor