CEEPR Working Paper 2019-011, July 2019
Patrick R. Brown and Francis M. O'Sullivan

While the cost of solar photovoltaics (PV) has fallen rapidly over the past decade, the U.S. electric power system has simultaneously undergone rapid changes. The deployment of variable renewable energy (VRE) capacity at large scale has begun to push down wholesale electricity prices, decreasing the market revenues of new VRE generators. [2] At the same time, the adoption of emissions-control technologies at coal generators has reduced the marginal emissions rate of air pollutants—delivering a clear public health benefit, but decreasing the relative public health benefits of PV deployment. [3]
What do these simultaneous reductions in the cost and value of PV imply for the net benefits of PV across the United States today? Here, we address this question by simulating the performance of new utility-scale PV generators at the sites of ~10,000 pricing nodes across the continental U.S. over 2010–2017. Our analysis covers six U.S. Independent System Operators: California ISO (CAISO), the Electric Reliability Council of Texas (ERCOT), Midwest ISO (MISO), the Pennsylvania-New Jersey-Maryland Interconnection (PJM), New York ISO (NYISO), and ISO-New England (ISONE). We combine historical satellite-derived weather data [4] with nodal electricity prices, capacity market prices, and marginal particulate matter and CO2 emissions rates from grid electricity [5] to assess the wholesale energy value, capacity value, public health benefits, and climate benefits of new PV generators.
The energy value of PV—assessed at the level of hourly nodal day-ahead locational marginal electricity prices (LMPs)—is found to vary significantly with location, even within the territory of a given ISO. Particularly along the east coast, transmission congestion results in nodal “hotspots” where in some years the wholesale market revenue of a PV generator is up to twice that at the median node across the system as a whole. In general, LMPs are found to vary more widely than PV capacity factors, such that a PV generator is more likely to maximize its revenues by selecting a high-LMP location than a high-capacity-factor location.
PV capacity revenues are typically 5-20% of energy revenues, but in some congested zones along the east coast (particularly around Boston and New York City) the capacity revenue can rise to 40-80% of the energy revenue. Both energy and capacity revenues have declined in California between 2010-2017 as PV penetration grew from ~2% of peak load to ~28% of peak load.
The marginal public health benefits associated with SO2, NOx, and direct PM2.5 emissions reductions have declined over the observed time range, but are still substantial in 2017: in monetary terms, the 2017 health benefits of PV generation are equivalent to ~70% of energy revenues in MISO and NYISO and 100% in PJM. CO2 offsets have been relatively stable over this timespan, ranging from ~0.9 tons/kWac per year in NYISO and ISONE to ~1.3 tons/kWac per year in ERCOT and MISO.
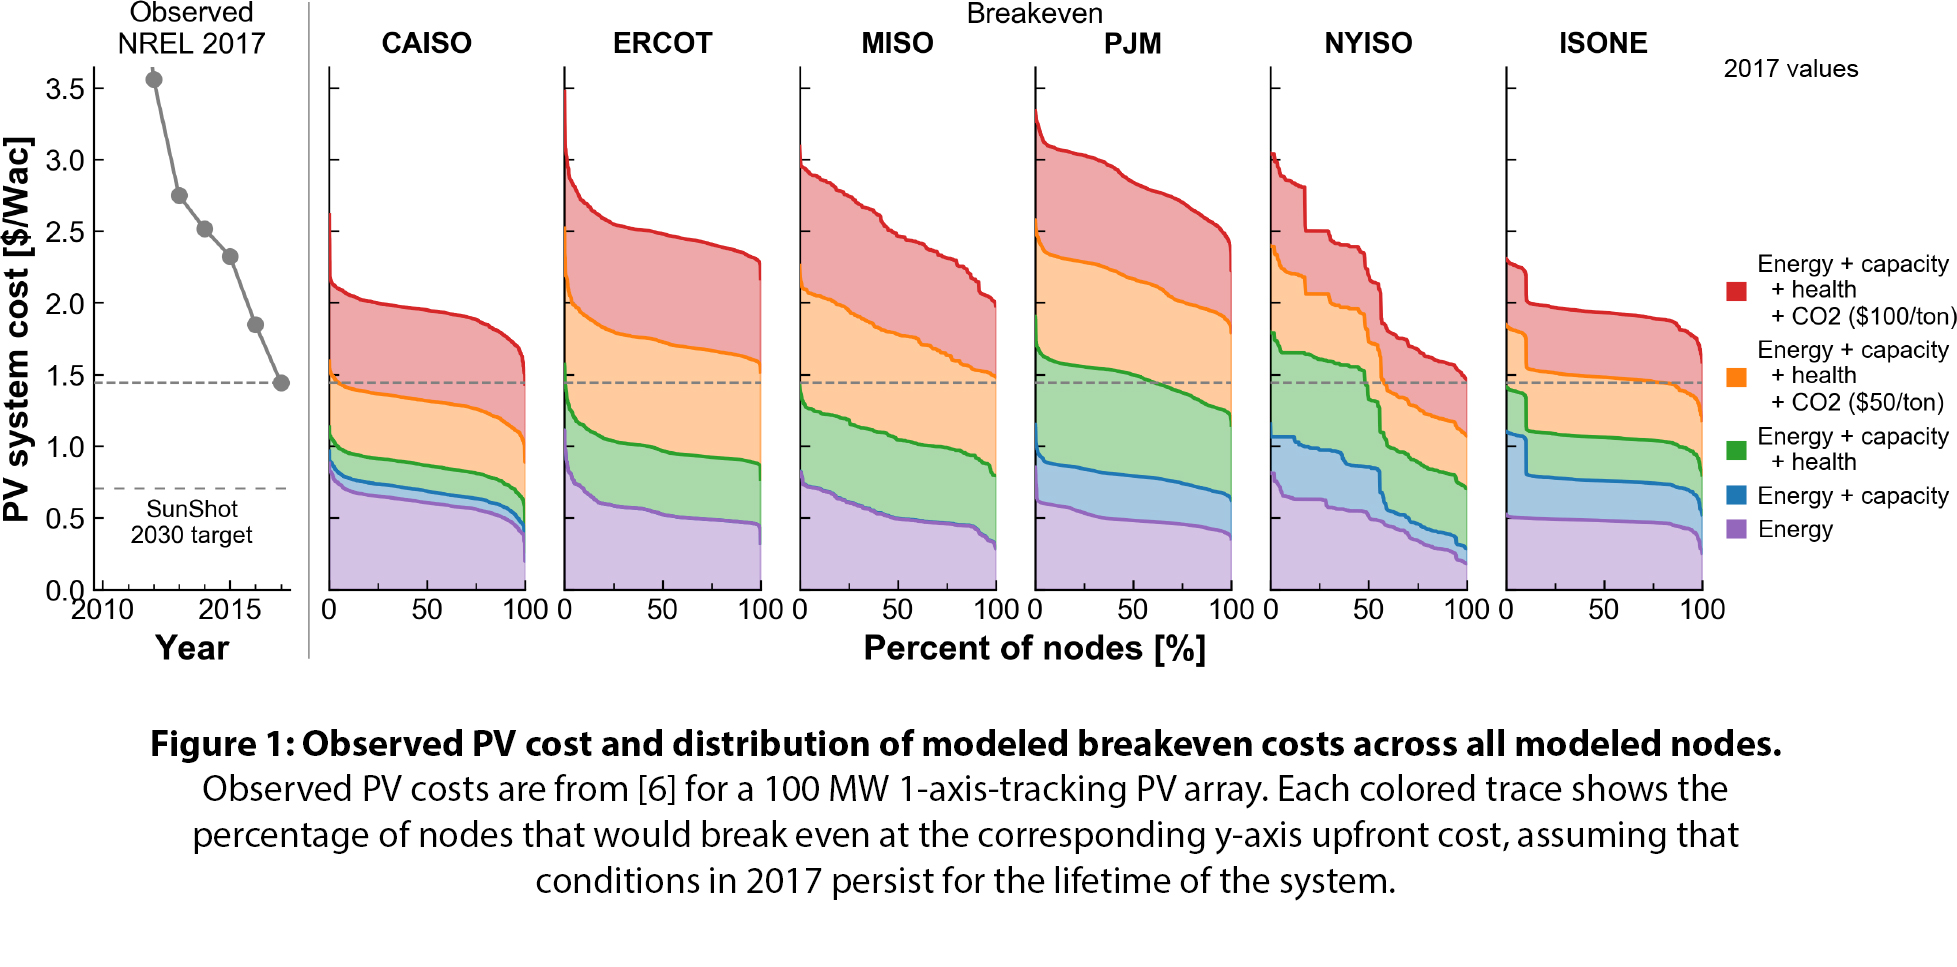
Adding together the calculated energy, capacity, health, and climate benefits of PV in 2017, we calculate the upfront PV system cost that would be required for new PV generators to “break even” in terms of net present value over their lifetime. We find that at 2017 PV system costs of ~$1.44/Wac, [6] PV would break even at ~30% of the modeled nodes on the basis of energy, capacity, and health benefits alone, at ~75% of nodes with a $50/ton CO2 price, and at 100% of nodes with a $100/ton CO2 price. At 2017 PV system costs, median breakeven CO2 prices range from $0/ton in PJM to $60/ton in CAISO if public health benefits are included, and from $45/ton in PJM to ~$80/ton in CAISO if health benefits are excluded.
Our results suggest that PV cost decline has outpaced value decline since 2010, such that in 2017 the market, health, and climate benefits of PV outweigh the cost of PV at the majority of the locations modeled. While the balance of PV’s benefits and costs will continue to evolve as PV penetration increases, the methods presented here can be used to provide continuously up-to-date estimates of the net benefits of PV and other distributed energy resources.
References
1) P. R. Brown and F. M. O’Sullivan (2019) “Spatial and Temporal Variation in the Value of Solar Power across United States Electricity Markets” , MIT CEEPR Working Paper 2019-011.
2) R. Wiser, A. Mills, J. Seel, T. Levin, and A. Botterud, “Impacts of Variable Renewable Energy on Bulk Power System Assets, Pricing, and Costs,” 2017. https://emp.lbl.gov/publications/impacts-variable-renewable-energy.
3) D. Millstein, R. Wiser, M. Bolinger, and G. Barbose, “The climate and air-quality benefits of wind and solar power in the United States,” Nat. Energy, vol. 2, no. 9, p. 17134, 2017.
4) National Renewable Energy Laboratory, “National Solar Radiation Database (NSRDB),” 2018. https://nsrdb.nrel.gov/.
5) I. L. Azevedo, N. C. Horner, K. Siler-Evans, and P. T. Vaishnav, “Electricity Marginal Factors Estimates,” 2017. https://cedm.shinyapps.io/MarginalFactors/.
6) R. Fu, D. Chung, T. Lowder, D. Feldman, and K. Ardani, “U.S. Solar Photovoltaic System Cost Benchmark: Q1 2017,” 2017. https://www.nrel.gov/docs/fy17osti/68925.pdf.
Further Reading: CEEPR WP 2019-011
About The Authors