James L. Smith

Oil Rig in Willison, North Dakota. Photo by Lindsey Gira.
The volume of future U.S. shale oil production depends directly on the number and productivity of potential drilling sites that remain to be tapped. Although estimates of future production must be forward looking, we show how the observed sequence of historical drilling results leads naturally to a statistical estimator of the remaining volume of technically recoverable resource. By studying the dynamic process of resource depletion, we are able to project future drilling results and calculate the expected volume of technically recoverable resources. An indication of the productivity of remaining drilling sites is also obtained, which allows us to estimate the portion of technically recoverable resources that could be produced economically at various price levels.
The method is based on two statistical hypotheses, both of which have been previously applied to the petroleum industry: sampling from the remaining population of potential drilling sites is assumed to occur without replacement and with probability of selection proportional to the productivity of individual wells. Sampling is without replacement because petroleum resources are finite in nature and subject to depletion. Resources that have been once produced cannot be produced again. Random sampling proportional to productivity reflects the industry’s general tendency to drill more productive prospects before less productive prospects.
In addition to accounting for resource depletion, our method also controls for the rapid increase in fracking efficiency that has occurred during the past decade. The potential productivity and relative attractiveness of any given drilling site is determined by physical factors that remain constant through time: total carbon concentration in the underlying shale, plasticity of the rock, thickness of the seam, pressure of the formation, etc. The most desirable sites are endowed with favorable characteristics, which increases the probability they will be selected for drilling. However, the actual productivity of each well that gets drilled also depends on the choice of fracking techniques. Operators have learned through experimentation how production from a given site can be increased by varying the length of the horizontal section, the number of fractures employed, the volume and pressure of water injected into the formation, and the type of proppant used in the procedure. These increases in fracking efficiency tend to mask the impact of resource depletion and therefore play an important role in our estimation procedure.
We illustrate the method by an application to the Bakken shale oil resources located in North Dakota. Since 2006, more than 12,000 horizontal fractured shale oil wells have been drilled there, and those wells constitute our sample data. For each well, we know the date on which drilling began and the recorded initial production rate. Based on the observed sequence of drilling outcomes, we measure the relative frequency of high versus low productivity wells and how it has changed over time—a pattern that reflects the stage of resource depletion. Based on the observed pattern, we estimate the remaining number of potential shale oil drilling sites in North Dakota to be roughly 52,000, which falls in the middle of the range of estimates published by the U.S. Geological Survey and the U.S. Energy Information Administration. We estimate those sites hold 17.0 billion barrels of technically recoverable shale oil, which is very close to EIA’s estimate of 16.8 billion barrels but much larger than USGS’s estimate of 7.1 billion barrels. All these estimates are based on the assumption that fracking efficiency remains constant at the 2015 level. It is probable that further increases in fracking efficiency will cause the actual volume of technically recoverable resources to exceed these estimates.
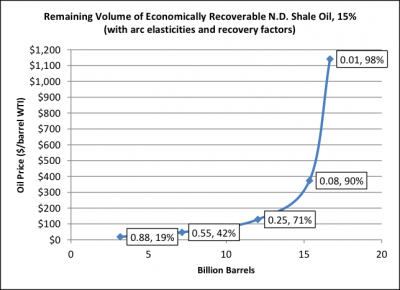
The USGS and EIA estimates do not reveal what portion of the remaining technically recoverable resources could be developed economically at various price levels. By accounting for the number of low versus high productivity wells that remain, our approach fills this gap. Still assuming 2015 fracking efficiency, we estimate that roughly half of the remaining technically recoverable resources would be economic at $50/barrel, and 75% would be economic at $130/barrel. An estimate of the volume of economic reserves as it relates to price—the supply curve of potential reserves—is shown below. A market price of $100/barrel would facilitate development of about 11 billion additional barrels of North Dakota shale oil. Beyond that point, marginal cost rises quickly and the supply curve becomes highly inelastic.
Although our illustration focuses on the Bakken region, the same analysis could be applied to any of the numerous shale oil plays that have emerged recently, and to shale gas plays as well. The Bakken happens to be one of the largest and most productive shale oil plays in the U.S., and is counted on to contribute substantially to future U.S. shale oil output. In addition to demonstrating a new methodological tool, our work therefore makes an important empirical contribution regarding future U.S. shale oil supply.
Further reading: CEEPR WP-2017-001
About The Authors