


CEEPR Working Paper 2026-15
Gunther Glenk, Katrin Gschwind, and Stefan Reichelstein
Companies in multiple industries face the challenge of assessing the costs of meeting voluntary carbon emission targets or complying with environmental regulations. For firms relying on a portfolio of operating assets, the decarbonization task is to optimize targeted changes for individual assets that differ in their cost or load profiles. Salient examples of such asset portfolios are commercial vehicle fleets, such as taxis, buses, trucks, cargo ships, and airplanes. Similar to firms in other industries, fleet operators seek to assess the economics of new drivetrain technologies across vehicles with varying duty cycles to achieve targeted emission reductions for the entire fleet.
This paper develops an abatement cost model for a portfolio of operating assets. Our base model considers a firm that acquires a vehicle fleet to meet a given, time-variant energy demand for transportation services. Each vehicle can be equipped with up to two drivetrain technologies, such as battery-electric and diesel, with combinations reflecting plug-in hybrid vehicles. The Total Cost of Ownership (TCO) of the fleet comprises all capacity-related and operational costs associated with the initial configuration and subsequent utilization of each vehicle, consistent with life-cycle costing in the accounting literature. Minimizing this life-cycle cost metric yields a closed-form solution for identifying the cost-efficient capacity sizes and deployment of drivetrains for each vehicle. Specifically, the configuration is determined by the point at which a vehicle’s load duration curve, the ordered demand profile it must satisfy, crosses a capacity utilization threshold given by its cost profile.
We calibrate our model framework to urban bus fleets in the current economic environment of California. Urban buses are heavy-duty vehicles that contribute to both global carbon emissions and local air pollution. Public transit agencies have also been among the first fleet operators to adopt low-emission drivetrain technologies. Based on new industry data for a fleet of 50 vehicles, our calculations project that the cost-efficient fleet comprises 41 plug-in hybrid, nine diesel, and no fully electric buses (Figure 1). Across vehicles in the fleet, electric drivetrains constitute 66% of usable installed capacity and deliver 88% of annual demand. Diesel drivetrains effectively function as “peaker” capacity, covering mainly occasional days of high demand.
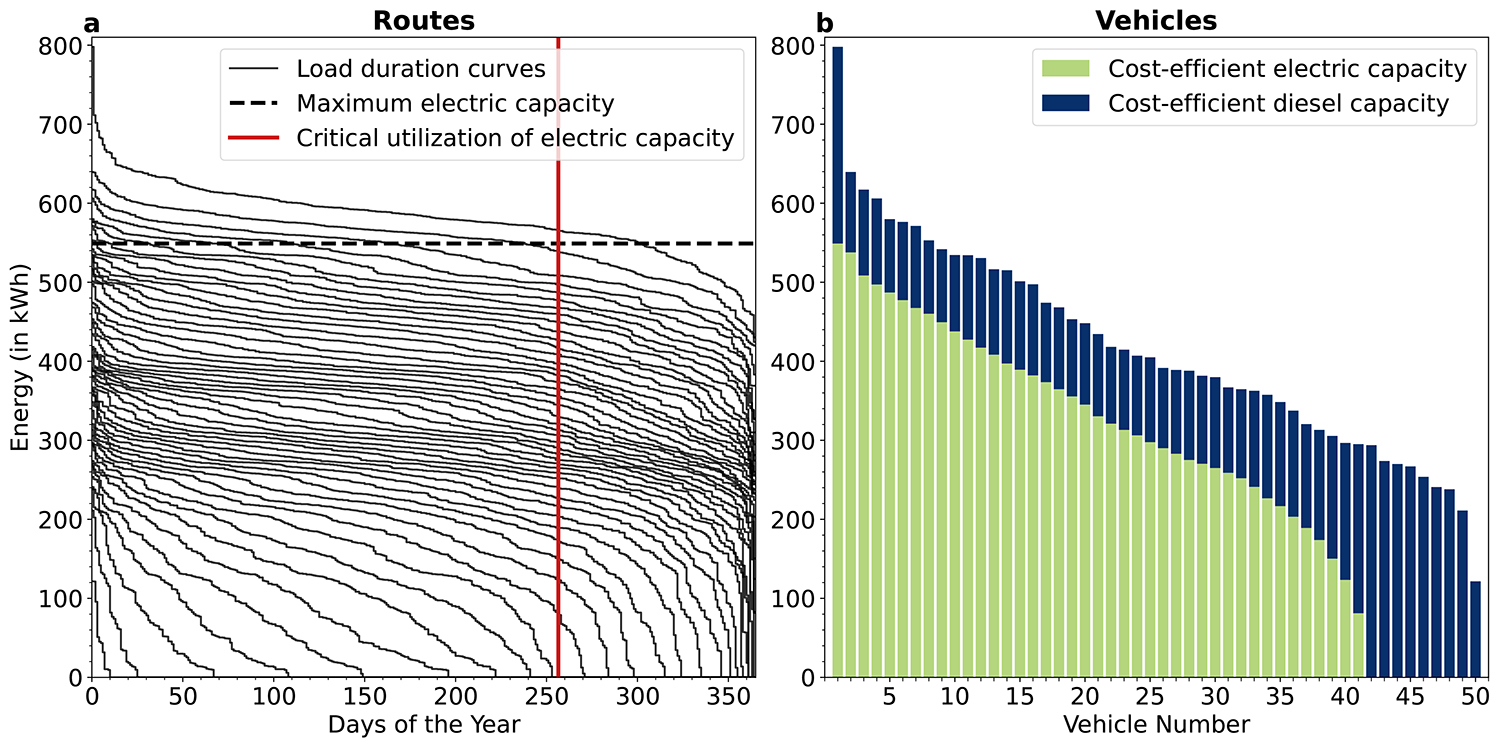
Figure 1. Cost-efficient urban bus fleet.
This figure shows (a) the load duration curves of buses in the fleet and (b) the cost-efficient capacity of the electric and diesel drivetrains of the buses.
We embed the TCO framework in a context where the fleet operator is tasked with meeting a particular direct (Scope 1) emission target. Such targets may stem from voluntary climate pledges or regulatory mandates such as registration bans or performance standards. For alternative targets, the Total Abatement Cost (TAC) is given by the total cost of ownership of the fleet that is minimal among all fleets whose future annual emissions do not exceed the target level. This cost measure yields a simple selection rule that decentralizes the challenge of decarbonizing the fleet to individual vehicles by supplementing the capacity utilization threshold in the unconstrained closed-form solution with the shadow price of meeting the fleet-wide emission target.
Our calculations for urban bus fleets show that their total abatement cost curves are strictly convex in abatement targets, reflecting the shape and relative distribution of load duration curves across vehicles. In particular, firms can achieve initial emission reductions at relatively low cost by expanding the electric capacity of plug-in hybrid buses with low initial electrification. Yet, total abatement costs rise sharply as firms pursue more ambitious targets and must electrify diesel buses, though this additional electric capacity will be used rarely and thus yields limited emission reductions. Despite the sharp increase in total abatement costs, our calculations project that even the lowest technologically feasible emission target increases the total cost of ownership by only 2.6% relative to the cost-efficient fleet.
We then examine the incentives for firms to adopt electric drivetrains in response to emission charges. These charges may reflect a carbon tax or market prices for emission permits under a cap-and-trade system, such as the California Cap-and-Trade Program. We find that if firms in California were to expect prevailing carbon prices to remain at their 2024 average value of $35 per ton of carbon dioxide equivalent (CO2e), they would be incentivized to expand electric drivetrains across vehicles such that they constitute 70% of usable installed capacity and 92% of annual demand. This reduces annual direct emissions by 31% relative to the cost-efficient fleet. At the same time, we find that the optimal emission response to carbon prices is highly inelastic due to convex tails of the load duration curves of the buses. If deep decarbonization of urban bus fleets is to be induced by carbon prices, these prices would thus have to rise to several hundred dollars per ton of CO2e.
A recurring concern in the public debate on carbon regulation is how alternative policy instruments affect the production costs of essential goods and services. Our cost framework estimates the increase in the levelized cost per mile when deep decarbonization is driven by either mandated emission targets or higher carbon prices. Specifically, if carbon prices in California were to remain at their 2024 average of $35 per ton of CO2e but urban bus fleets were mandated to reduce direct emissions to the lowest feasible level, their levelized cost per mile would rise by 2.4% relative to no mandate (Figure 2). If the same emission level were to be induced via higher carbon prices instead, the levelized cost per mile would rise by 19.9% relative to no higher carbon prices. This substantially larger increase in private compliance cost reflects higher charges on residual emissions and the fairly inelastic emission response to carbon prices.
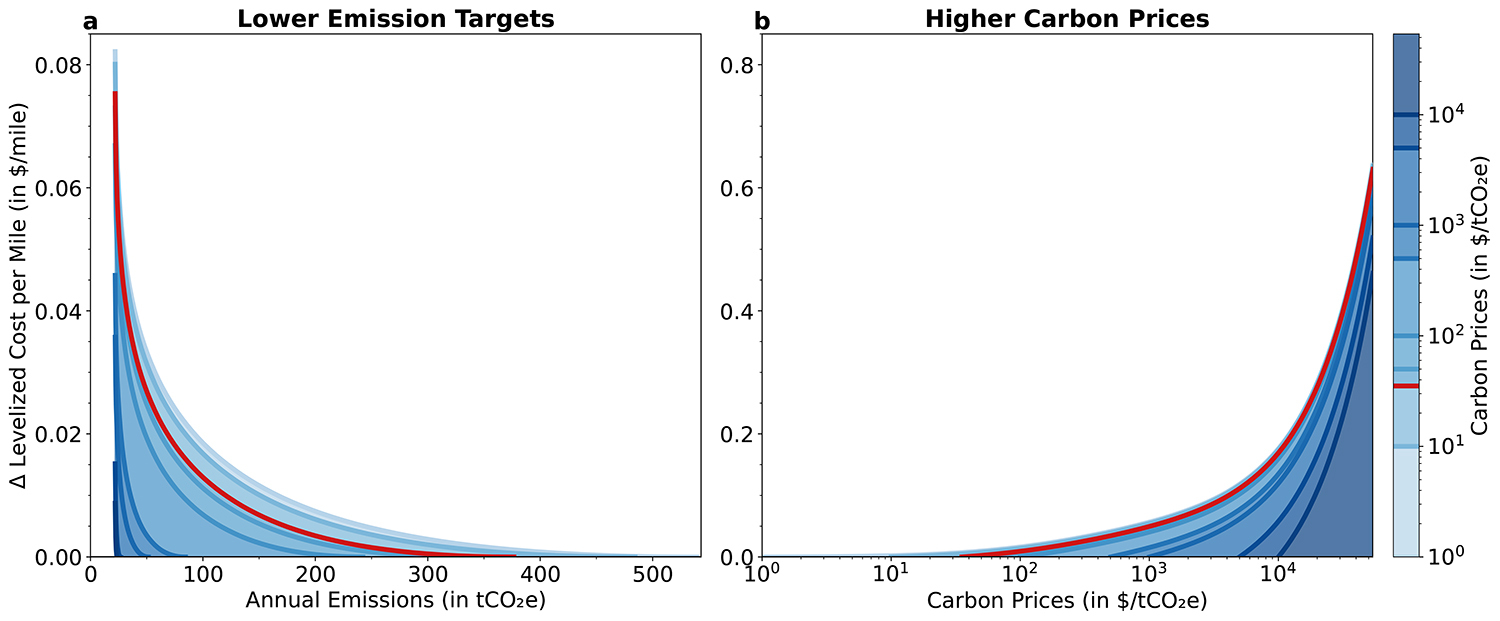
Figure 2. Change in the levelized cost per mile of urban buses.
This figure shows (a) the resulting change in the levelized cost per mile when firms seek to reduce emissions from the optimal response level to the prevailing carbon price to some lower target level, and (b) the resulting change in the levelized cost per mile when the prevailing carbon price increases from some level to a higher level.
Our analysis provides a fairly robust assessment of the cost-efficient configuration and the costs of decarbonizing urban bus fleets today. Yet, rapid advances in battery technology and emerging low-emission fuel substitutes point to further cost reductions in the near term. For example, if battery technology improves as projected (Link et al., 2024), we estimate that (near) complete decarbonization would raise the total cost of ownership by only 1.7-2.4% relative to the cost-efficient fleet. Since the optimal emission response to carbon prices remains fairly inelastic, our results support the view that carbon pricing and emission performance standards are complementary policy instruments for deeply decarbonizing vehicle fleets (Stechemesser et al., 2024). Overall, our findings are consistent with the recent surge in the adoption of battery-electric transit buses worldwide.
Beyond urban buses, our model is directly applicable to other vehicle fleets. Our results indicate that fleets with regular duty cycles anchored at central depots (e.g., delivery vans and trucks, municipal and (air)port vehicles, and local ferries) are prone to high shares of electric drivetrain capacity in the cost-efficient configuration and to achieve deep decarbonization at modest cost. In contrast, fleets operating multi-leg rotations with energy-intensive routes (e.g., long-haul trucks, cargo ships, and commercial airplanes) will likely continue to rely primarily on conventional drivetrains for the cost-efficient configuration in the near future. Moving further afield, we argue that our model can also be adapted to other industries with multiple operating assets. For example, technology companies can adapt our model to assess the costs of deploying renewable energy and storage across data centers worldwide, accounting for local and temporal variations in computing demand and the availability of wind and solar power.
Link to the full working paper and full citations:
MIT CEEPR Working Paper 2026-15
About The Authors