CEEPR Working Paper 2020-021, December 2020
Benny Siu Hon Ng, Christopher R. Knittel, and Caroline Uhler

Within the US electricity market, renewable technologies are often evaluated using the Levelized cost of electricity (LCOE), which is a measure of building and operating a generating plant over an assumed financial life and duty cycle. Naturally, instead of only measuring the cost, a more holistic approach would be to also assess the economical value of the renewable generating technology. In this research, we will use the Levelized Avoided Cost of Electricity (LACE), which considers what it will economic benefits it brings the grid to generate electricity, amortized over its lifetime, to understand the following: 1) can we better leverage on Machine Learning and Optimization techniques to achieve better estimates of the value of solar technology; 2) based on these estimates, how does this compare against traditional cost estimates of alternative energy; 3) can we place an implict value on an improvement of price prediction, especially in the context of making better decisions during policy considerations.
To address these questions, we will implement current state of the art machine learning techniques to forecast 2016 electricity prices within the CAISO electricity market. Specifically, we will be experimenting with different variants of a recurrent neural network (RNN), which includes starting with an basic RNN, and then adding Gated Recurrent Units (GRU) and Long Short-Term Memory (LSTM) units to train a model that will return the best prediction accuracy. Part of creating this model will also involve carrying out hyperparameter tuning, using a basic grid search algorithm, to compare among different model architectures and select a final model architecture that is customized to the CAISO market and has the best prediction power. These predicted prices will be incorporated with meteorological data, such as solar radiation values, in the respective nodal locations to determine the LACE of solar technology across all the various nodes in the CAISO market.
We continue to investigate on the effects of improving the prediction power of electricity prices and its impact on respective LACE values. This will be done through understanding underlying characteristics of the prediction errors from our machine learning model. Subsequently, we will simulate new prediction errors with various scale and analyze the respective LACE values determined.
From a policy and decision making perspective, the LCOE is currently still the leading measure when it comes to evaluating alternative sources of electricity generation. We will relate this to the LACE of respecitve nodes calculated and identify a breakeven cost to determine when and how decision makers can evaluate benefits of switching to solar alternatives. Finally, linking back to a machine learning view, we will estimate an implict value to the benefits that an improvement of prediction performance of machine learning can bring to decision makers.
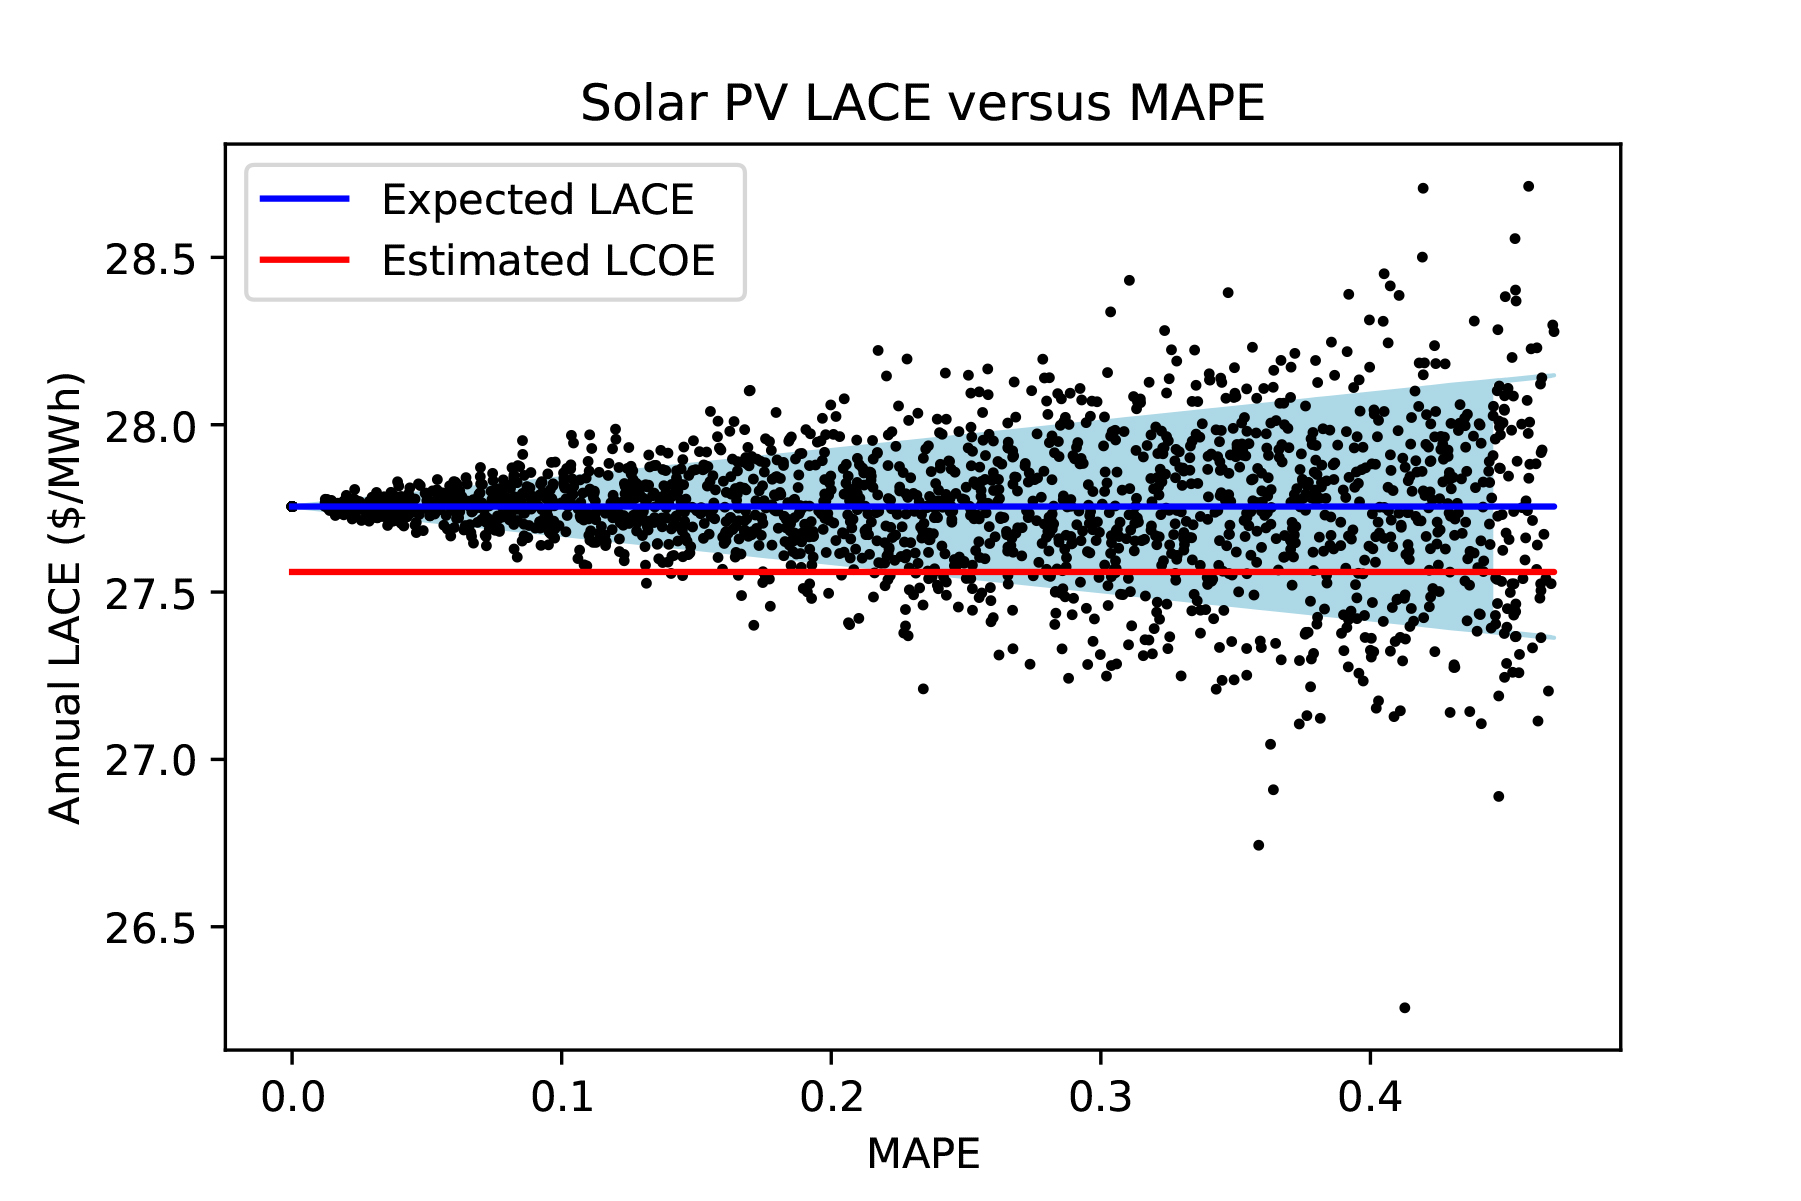
Overall, a LSTM model was found to be the best model to predict hourly CAISO electricity prices with an Mean Absolute Scaled Error (MASE) of 0.761, indicating that the prediction performance outperforms a naïve baseline of using the DA price of the same hour. An indepth analysis of the prediction errors found that they follow a normal distribution and this relationship was used to simulate 2000 ‘predictions’ to compare the expected LACE to the respective simulated Mean Absolute Percentage Error (MAPE) rate. Figure 1 below shows an example of simulated LACE versus MAPE with the blue line indicating the expected LACE. The breakeven point is determined when you incorporated the estimated LCOE (red line) of solar at the node, with a LACE valuation above the LCOE presenting a strong case for a switch to alternative sources of electricity generation. With reduced variability of our LACE valuation, the greater confidence of being above the breakeven point (figure 1). This represents an approximate change of 1% decrease in confidence for every % increase in MAPE. Our prediction model currently reports a MAPE of about 0.25. Based on current LCOE values from EIA Annual Report 2020, when we this compare with the LACE computed from our model, only less than 0.5% of nodes in CAISO would break even at today’s LCOE for solar PV.

Figure 1: Plot of simulated LACE versus Mean Absolute Percentage Error (n = 2000) for an example node in CAISO. The blue line indicates the expected LACE based on 2016 predicted prices, the red line indicates the estimated LCOE, and the light blue area denotes the standard deviation of the simulated LACE computation.
References
Benny Siu Hon Ng, Christopher R. Knittel, and Caroline Uhler (2020) “A Machine Learning Approach to Evaluating Renewable Energy Technology: An Alternative LACE Study on Solar Photo-Voltaic (PV)”, MIT CEEPR Working Paper 2020-021.
Further Reading: CEEPR WP 2020-021


